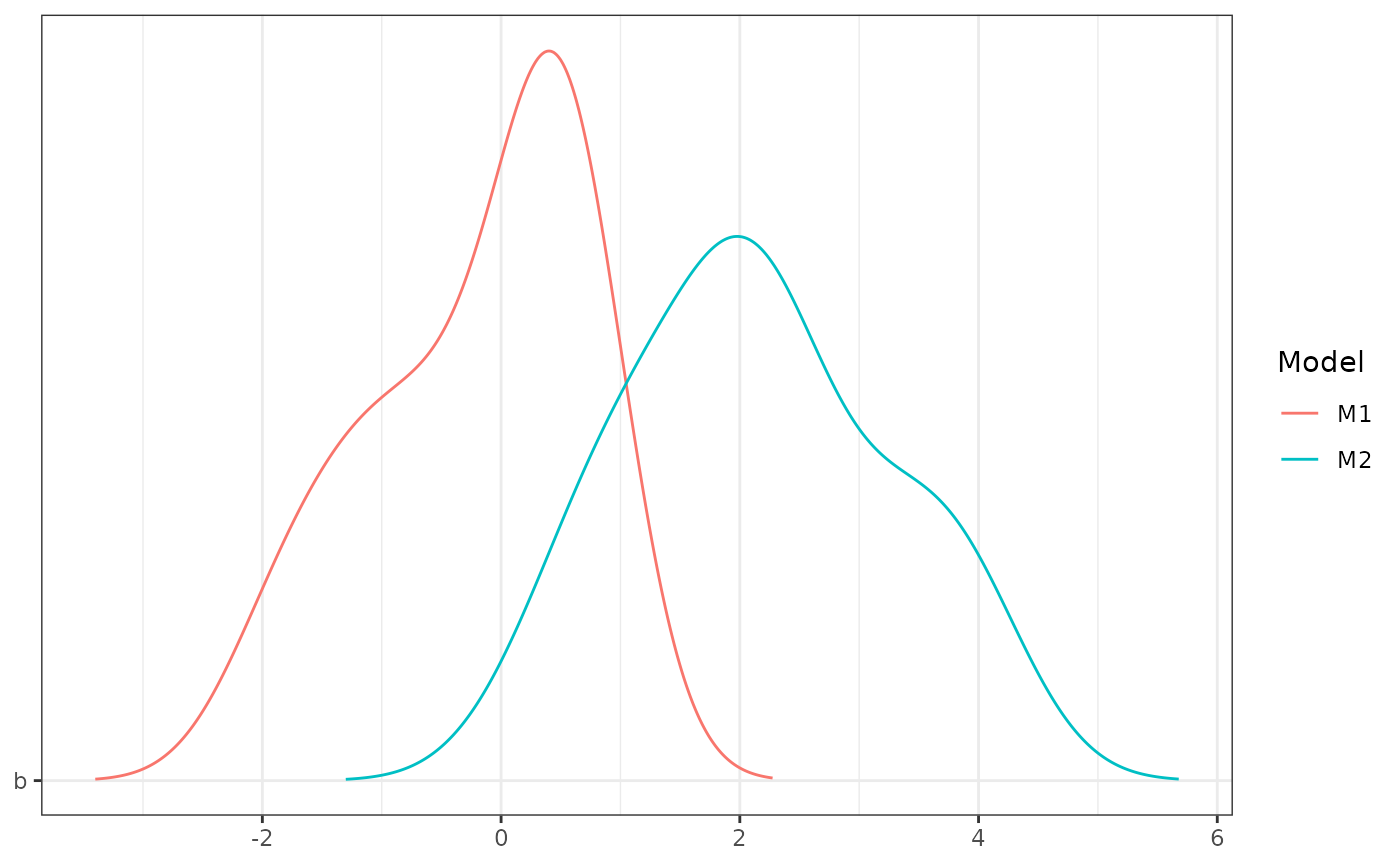
To perform a rudimentary sensitivity analysis, plot the posterior distributions of multiple BRMA models and compare them visually.
Arguments
- ...
Objects of class
brma. If the argumentmodel_namesisNULL, the names of these objects are used to label the plot.- parameters
Optional character vector with the names of parameters that exist in the models in
..., Default:NULL.- model_names
Optional character vector with the names used to label the models in
..., Default:NULL
Examples
plot_sensitivity(samples = list(
data.frame(Parameter = "b",
Value = rnorm(10),
Model = "M1"),
data.frame(Parameter = "b",
Value = rnorm(10, mean = 2),
Model = "M2")),
parameters = "b")
