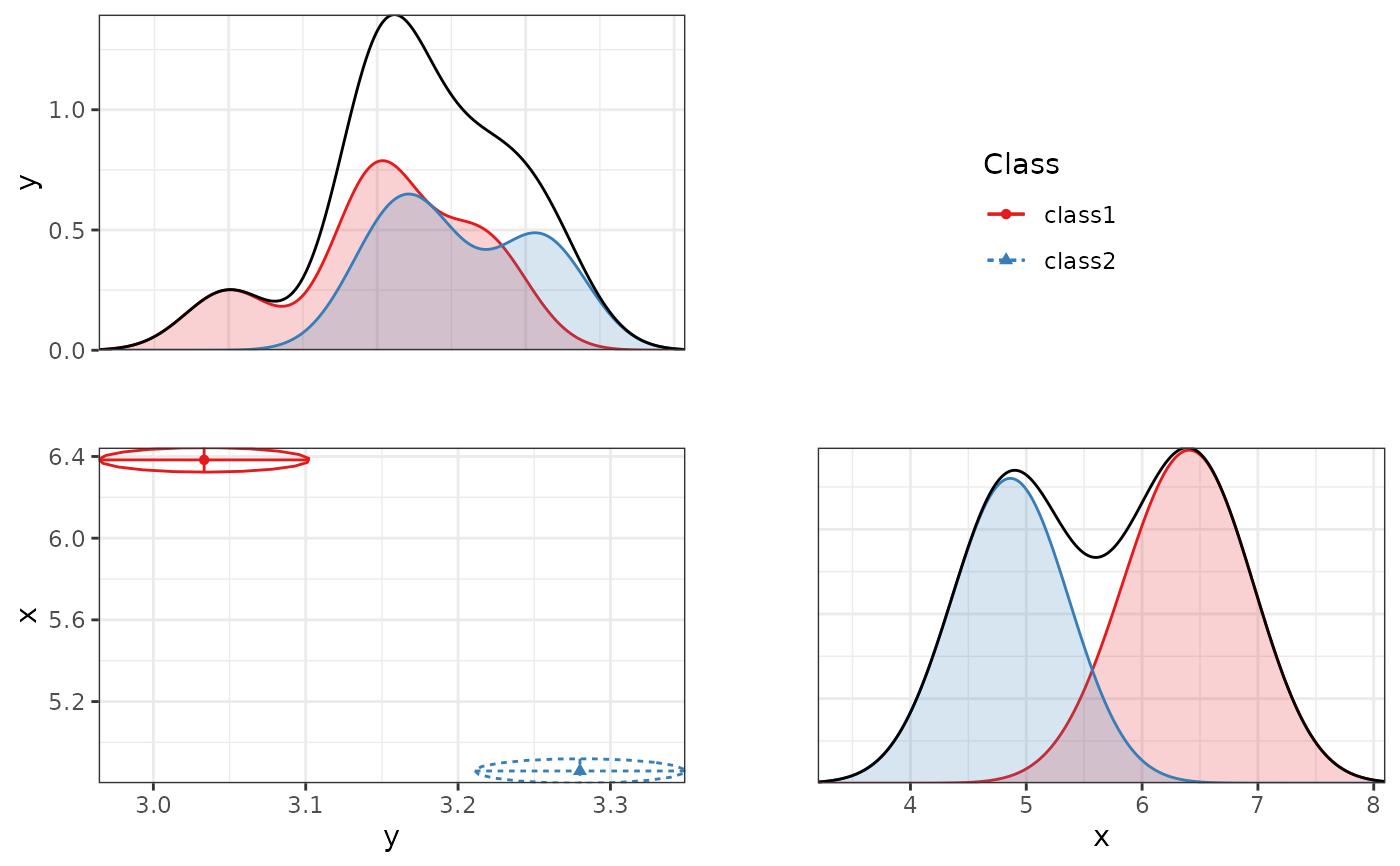
Creates a faceted plot of two-dimensional correlation plots and unidimensional density plots for a single mixture model.
Usage
plot_bivariate(
  x,
  variables = NULL,
  sd = TRUE,
  cors = TRUE,
  rawdata = TRUE,
  bw = FALSE,
  alpha_range = c(0, 0.1),
  return_list = FALSE,
  ...
)
Arguments
- x
An object for which a method exists.
- variables
Which variables to plot. If NULL, plots all variables that are present in the model.
- sd
Logical. Whether to show the estimated standard deviations as lines emanating from the cluster centroid.
- cors
Logical. Whether to show the estimated correlation (standardized covariance) as ellipses surrounding the cluster centroid.
- rawdata
Logical. Whether to plot raw data, weighted by posterior class probability.
- bw
Logical. Whether to make a black and white plot (for print) or a color plot. Defaults to FALSE, because these density plots are hard to read in black and white.
- alpha_range
Numeric vector (0-1). Sets the transparency of geom_density and geom_point.
- return_list
Logical. Whether to return a list of ggplot objects, or just the final plot. Defaults to FALSE.
- ...
Additional arguments.
Examples
if(requireNamespace("OpenMx", quietly = TRUE)){
library(OpenMx)
iris_sample <- iris[c(1:5, 145:150), c("Sepal.Length", "Sepal.Width")]
names(iris_sample) <- c("x", "y")
res <- mx_profiles(iris_sample, classes = 2)
plot_bivariate(res, rawdata = FALSE)
}
#> Running mix2 with 7 parameters