6.1 Generating a Forest Plot
To produce a forest plot, we use the meta-analysis output we just created (e.g., m, m_re) and apply the rma::forest() function.
forest(m_re, slab = df$study_id)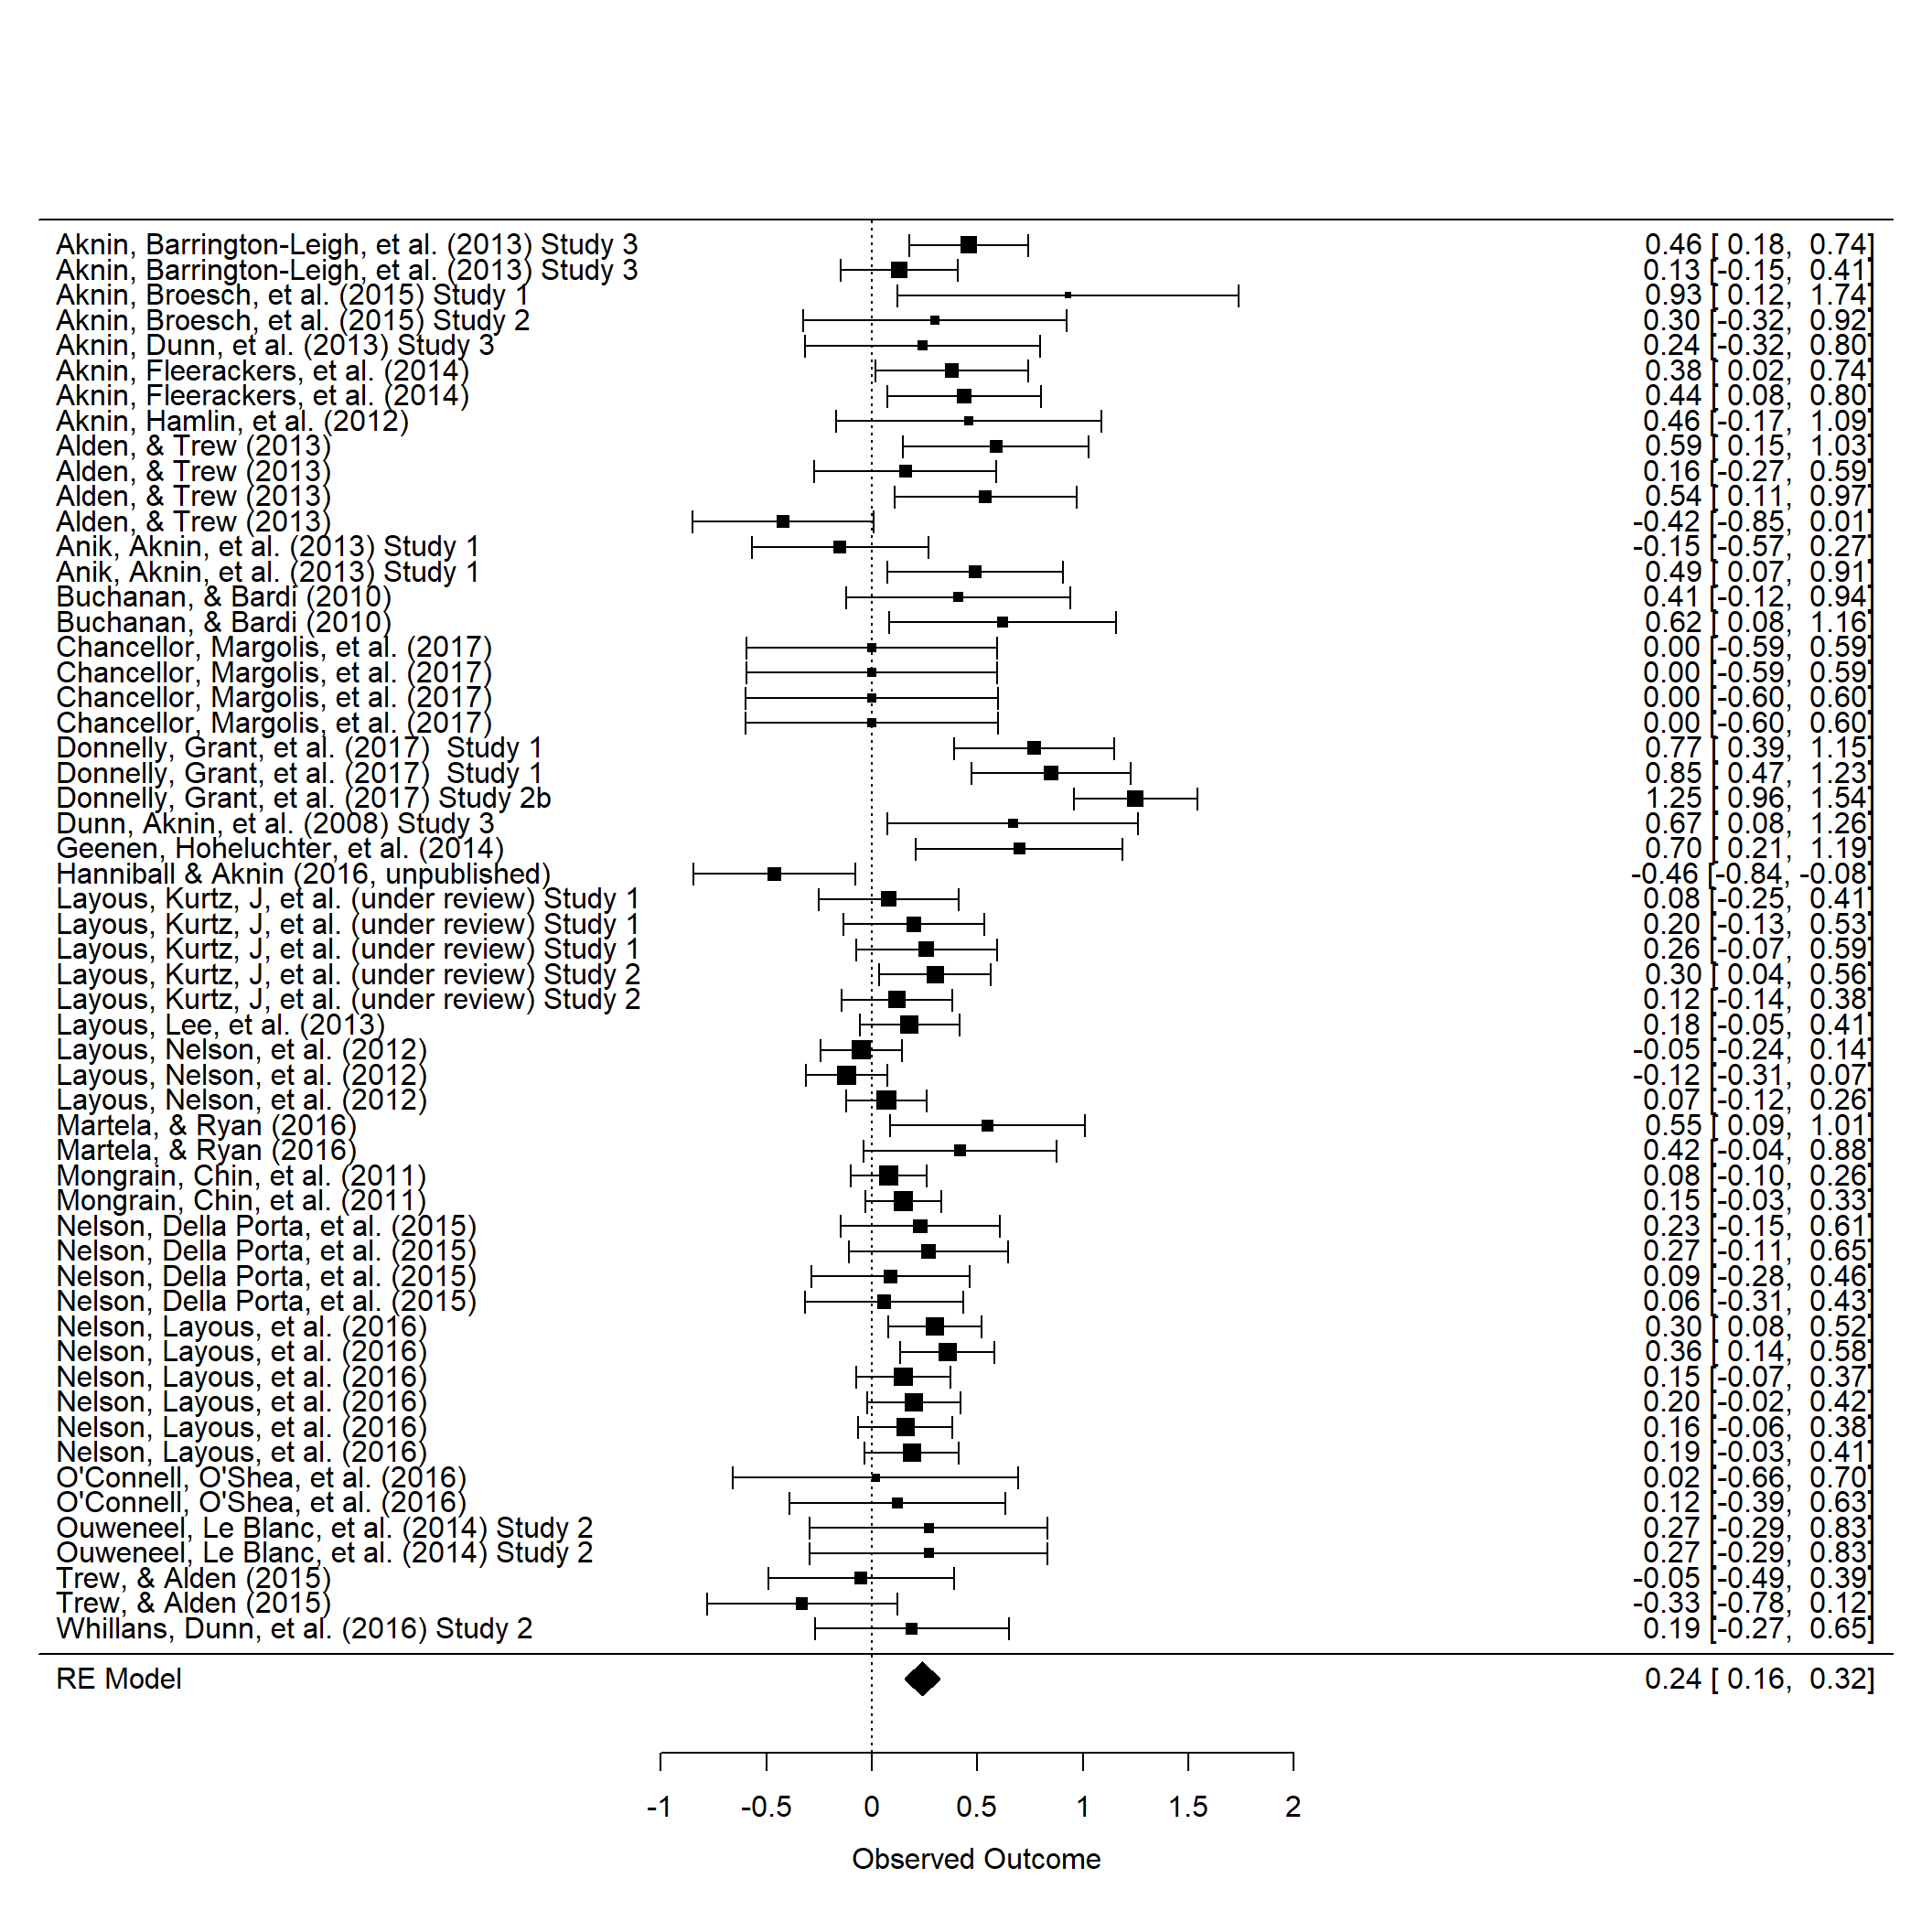
6.1.1 Prediction interval
Prediction intervals give us a range for which we can expect the effects of future studies to fall based on our present evidence in the meta-analysis. They take the between-study variance into account. If our prediction interval, for example, lies completely on the positive side favoring the intervention, we can be quite confident to say that despite varying effects, the intervention might be at least in some way beneficial in all contexts we studied in the future. If the confidence interval includes zero, we can be less sure about this, although it should be noted that broad prediction intervals are quite common, especially in medicine and psychology. We can simply add a prediction interval to the forest plot:
forest(m_re, slab = df$study_id, addcred = TRUE)