11.1 Meta-Analysis is multi-level (optional)
To see why meta-analysis is by nature multileveled, let us go back to the formula for the random-effects model we discussed in Chapter 5.2:
\[\hat\theta_k = \mu + \epsilon_k + \zeta_k\]
We discussed that the terms \(\epsilon_k\) and \(\zeta_k\) are introduced in a random-effects model because we assume that there are two sources of variability. The first one is caused by the sampling error (\(\epsilon_k\)) of individual studies, which causes their effect size estimates to deviate from the true effect size \(\theta_k\). The second one, \(\zeta_k\) is the between-study heterogeneity caused by the fact that the true effect size of a study \(k\) itself is again only part of an overarching distribution of true effect sizes, from which the individual true effect size \(\theta_k\) was drawn. Our aim in the random-effects model is therefore to estimate the mean of this distribution of true effect sizes, \(\mu\).
The two error terms correspond with the two levels within our meta-analysis data: the “participant” level (level 1) and the “study” level (level 2). The figure below symbolizes this structure. In the lower level (level 1), we have the participants (and/or patients). These participants are, of course, part of a number of larger units, the studies (level 2), from which we retrieved the data for our meta-analysis. While the data on level 1 usually already reaches us, the meta-analysts, in a “pooled” form (e.g., the authors of the paper provide us with the mean and standard deviation of their studied sample instead of the raw data), pooling on level 2, the study level, has to be performed in meta-analysis. In the tradition of multilevel modeling, such data is called nested data: in most meta-analyses, one can say that participants are “nested” within studies.
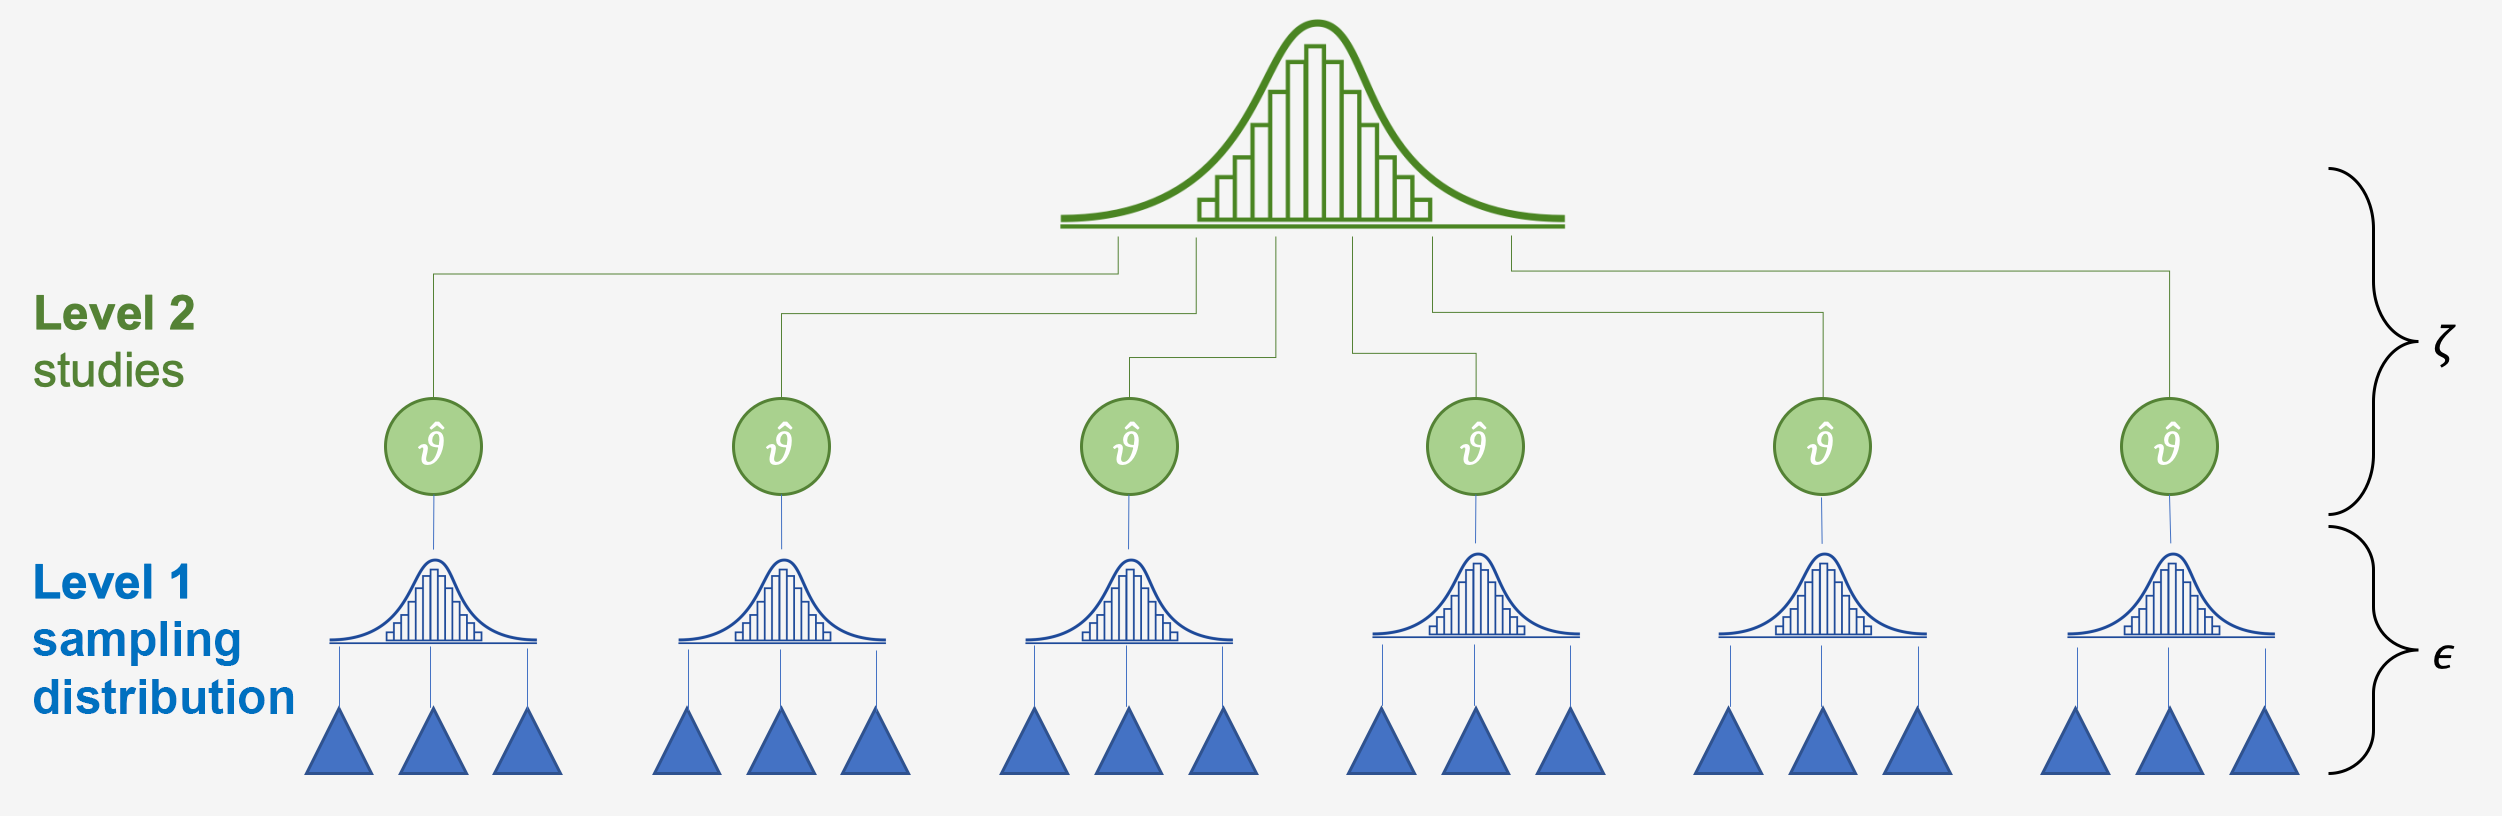
A simplified illustration of the multilevel structure of conventional meta-analytic models
Thus, if we split the formula from above into the components corresponding to the two levels, we get the following formulae:
Level 1 (participants) model:
\[\begin{equation} \label{eq:1} \hat\theta_k = \theta_k + \epsilon_k \end{equation}\]
Level 2 (studies) model:
\[\begin{equation} \label{eq:2} \theta_k = \mu + \zeta_k \end{equation}\]
You might have already detected that we can substitute \(\theta_k\) in the first equation with its definition in the second equation. What we then get is exactly the generic formula for the meta-analytic model from before (even a fixed-effects model can be defined as having a multilevel structure, yet with \(\zeta_k\) being zero). Thus, it becomes evident that the way we define a meta-analytic model already has multilevel properties “built-in” given that we assume that participants are nested within studies in our data.
11.1.1 Three-level meta-analytic models
It has become clear that meta-analysis naturally possesses a multilevel structure. This allows us to expand this structure even further to better reflect our data. Three-level models (Cheung 2014; Assink and Wibbelink 2016) are a good way to do this.
Statistical independence is one of the core assumptions of meta-analytic pooling (Hedges 2009). If there is a dependency between effect sizes (i.e., the effect sizes are correlated), this may artificially reduce heterogeneity and thus lead to false-positive results.
Dependence may stem from different sources (Cheung 2014):
- Dependence introduced by the authors of the individual studies. For example, scientists conducting the study might have collected data from multiple sites, or they might have compared multiple interventions to one single control group, or they might have used different questionnaires to measure an outcome of interest (e.g., they used the BDI as well as the PHQ-9 to assess depression in patients). For all of these scenarios, we can assume that some kind of dependency is introduced within the reported data.
- Dependence introduced by the meta-analyst herself. For example, a meta-analysis could focus on a specific psychological mechanism and include studies which were conducted in different cultural regions of the world. It seems reasonable that the reported results are more similar when studies were conducted in the same cultural context.
We can take such dependencies into account by integrating a third layer into the structure of our meta-analysis model. For example, one could model that different questionnaires are nested within studies. Or one could create a model in which studies are nested within cultural regions. This creates a three-level meta-analytic model, as illustrated by the figure below.
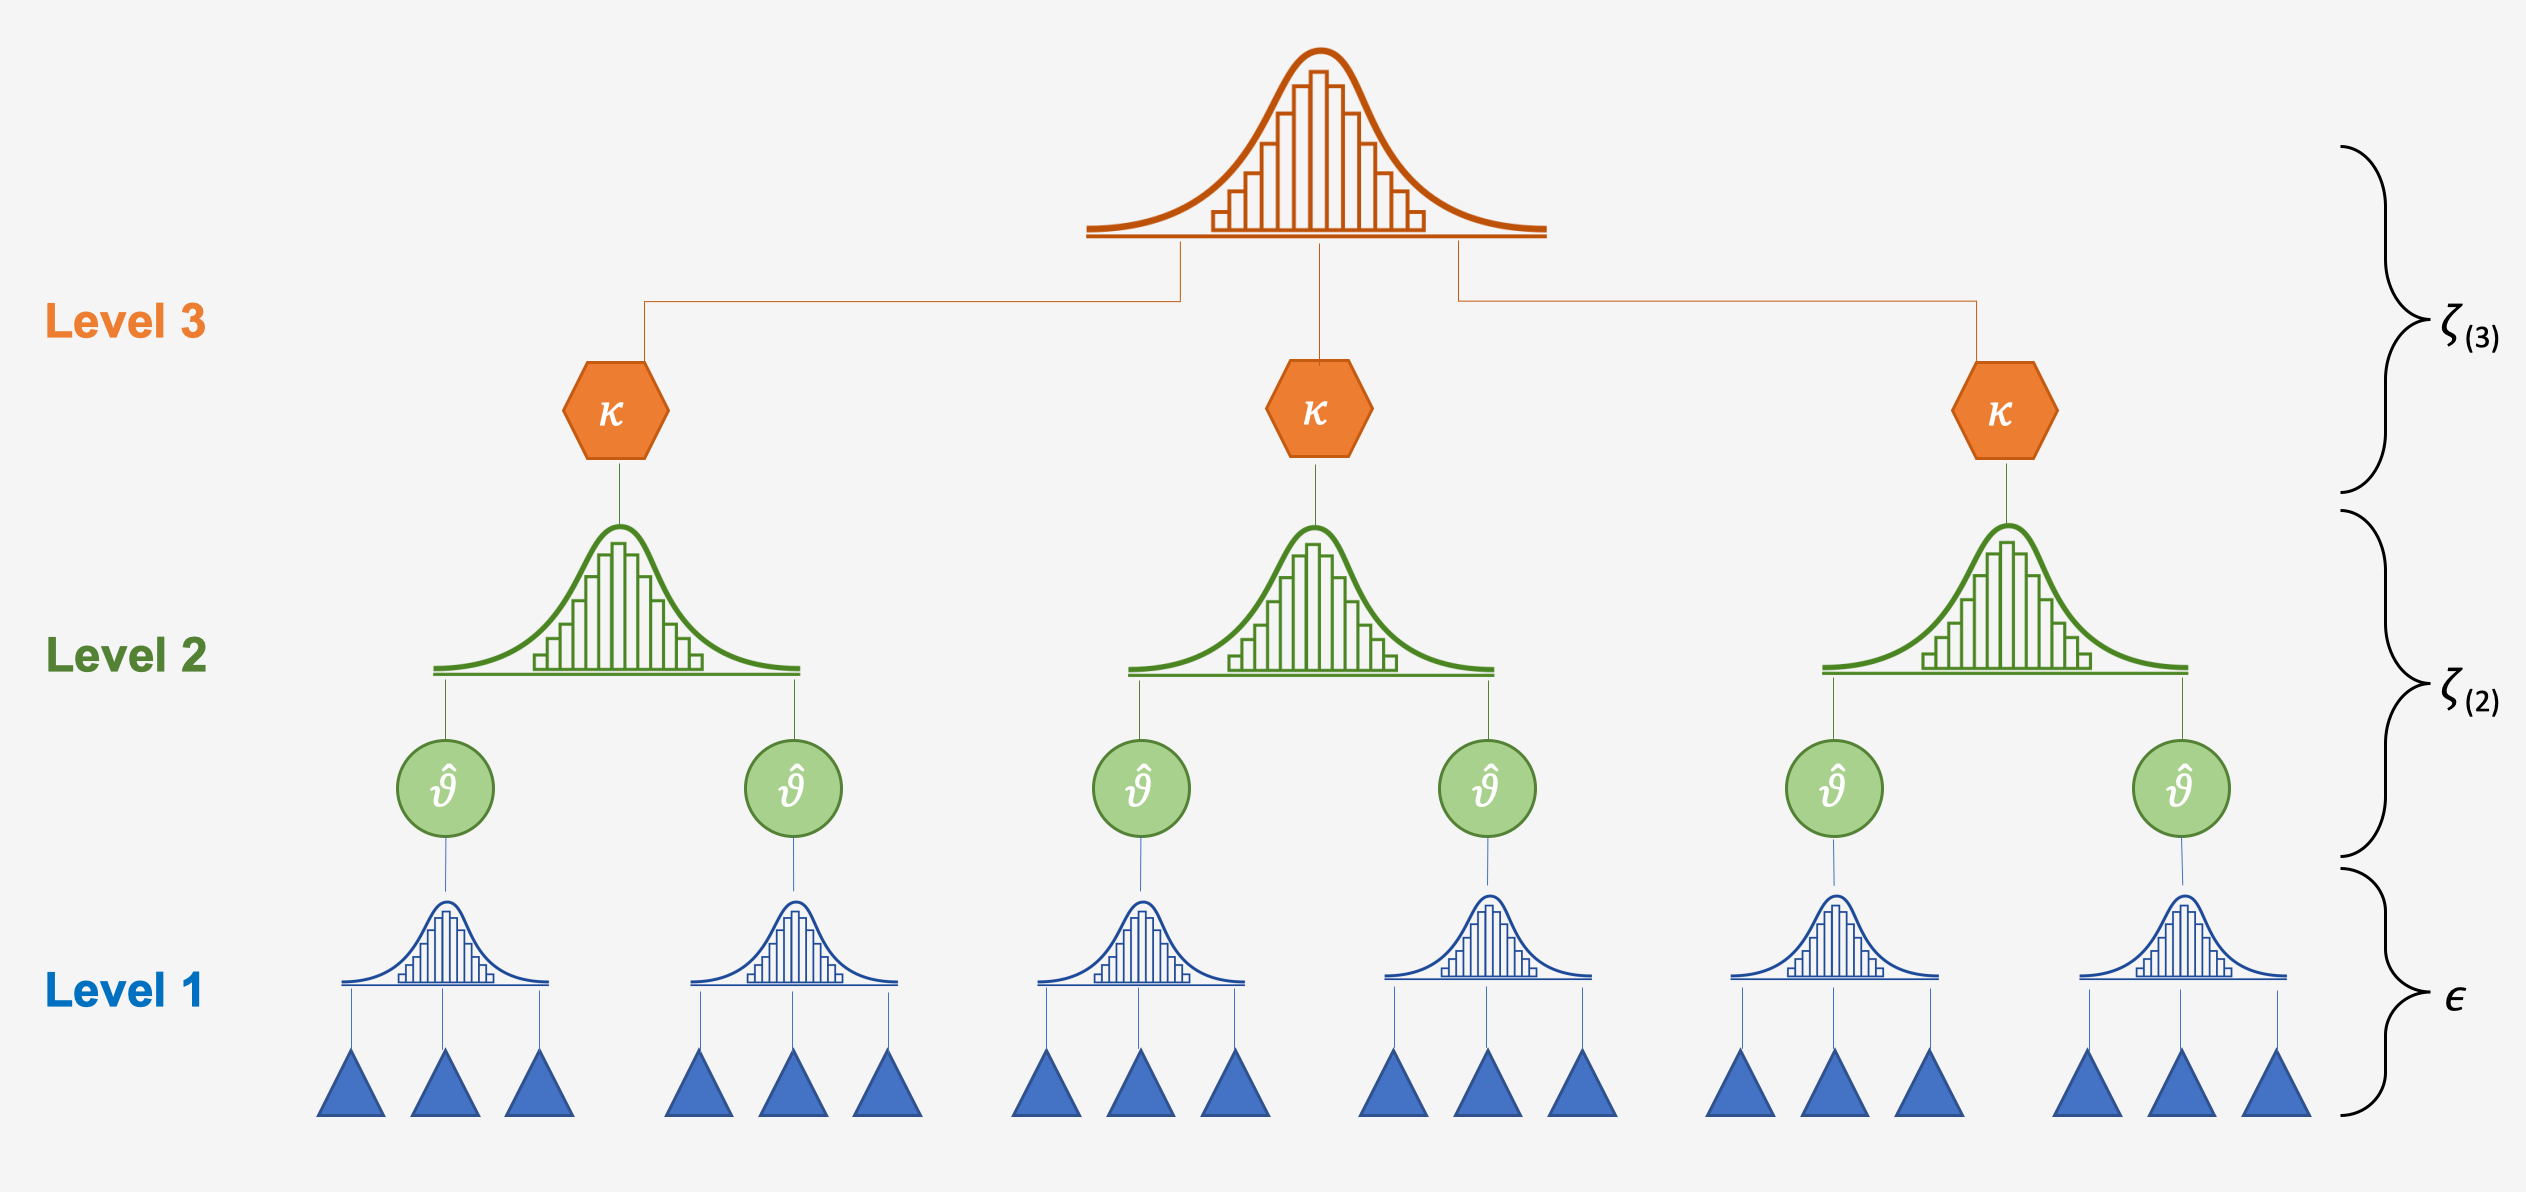
The generic mathematical formulae for a three-level meta-analytic model look like this:
Level 1 model
\[\hat\theta_{ij} = \theta_{ij} + \epsilon_{ij}\]
Level 2 model
\[\theta_{ij} = \kappa_{j} + \zeta_{(2)ij}\]
Level 3 model
\[\kappa_{j} = \beta_{0} + \zeta_{(3)j}\]
Where \(\theta_{ij}\) is the true effect size, \(\hat\theta_{ij}\) its estimator in the \(i\)th effect size in cluster \(j\), \(\kappa_{j}\) the average effect size in \(j\) and \(\beta_0\) the average population effect. Again, we can piece these formulae together and get this:
\[\hat\theta_{ij} = \beta_{0} + \zeta_{(2)ij} + \zeta_{(3)j} + \epsilon_{ij}\]
References
Assink, Mark, and Carlijn JM Wibbelink. 2016. “Fitting Three-Level Meta-Analytic Models in R: A Step-by-Step Tutorial.” The Quantitative Methods for Psychology 12 (3): 154–74.
Cheung, Mike W-L. 2014. “Modeling Dependent Effect Sizes with Three-Level Meta-Analyses: A Structural Equation Modeling Approach.” Psychological Methods 19 (2). American Psychological Association: 211.
Hedges, Larry V. 2009. “Statistical Considerations.” The Handbook of Research Synthesis and Meta-Analysis. Russell Sage Foundation New York, 38–47.